How Kourier captures API traffic directly on physical devices using native interception, shared KMP telemetry, privacy-aware logging, HAR/cURL export, and production-safe no-op builds.
Debugging an API failure is easy when you have Android Studio, Xcode, logs, breakpoints, Charles, Proxyman, or another debugging tool in front of you.
It gets harder when the person reproducing the problem only has a phone.
A QA engineer sees a failed API call.
A client encounters an error during a demo.
Android succeeds while iOS fails.
Or somebody sends engineering a screenshot saying:
“The API is failing.”
At that point, the important question is no longer whether the networking code works.
It is:
What exactly left the device, what came back, and how quickly can the person holding that device give engineering enough information to investigate it?
That problem led me to build Kourier.
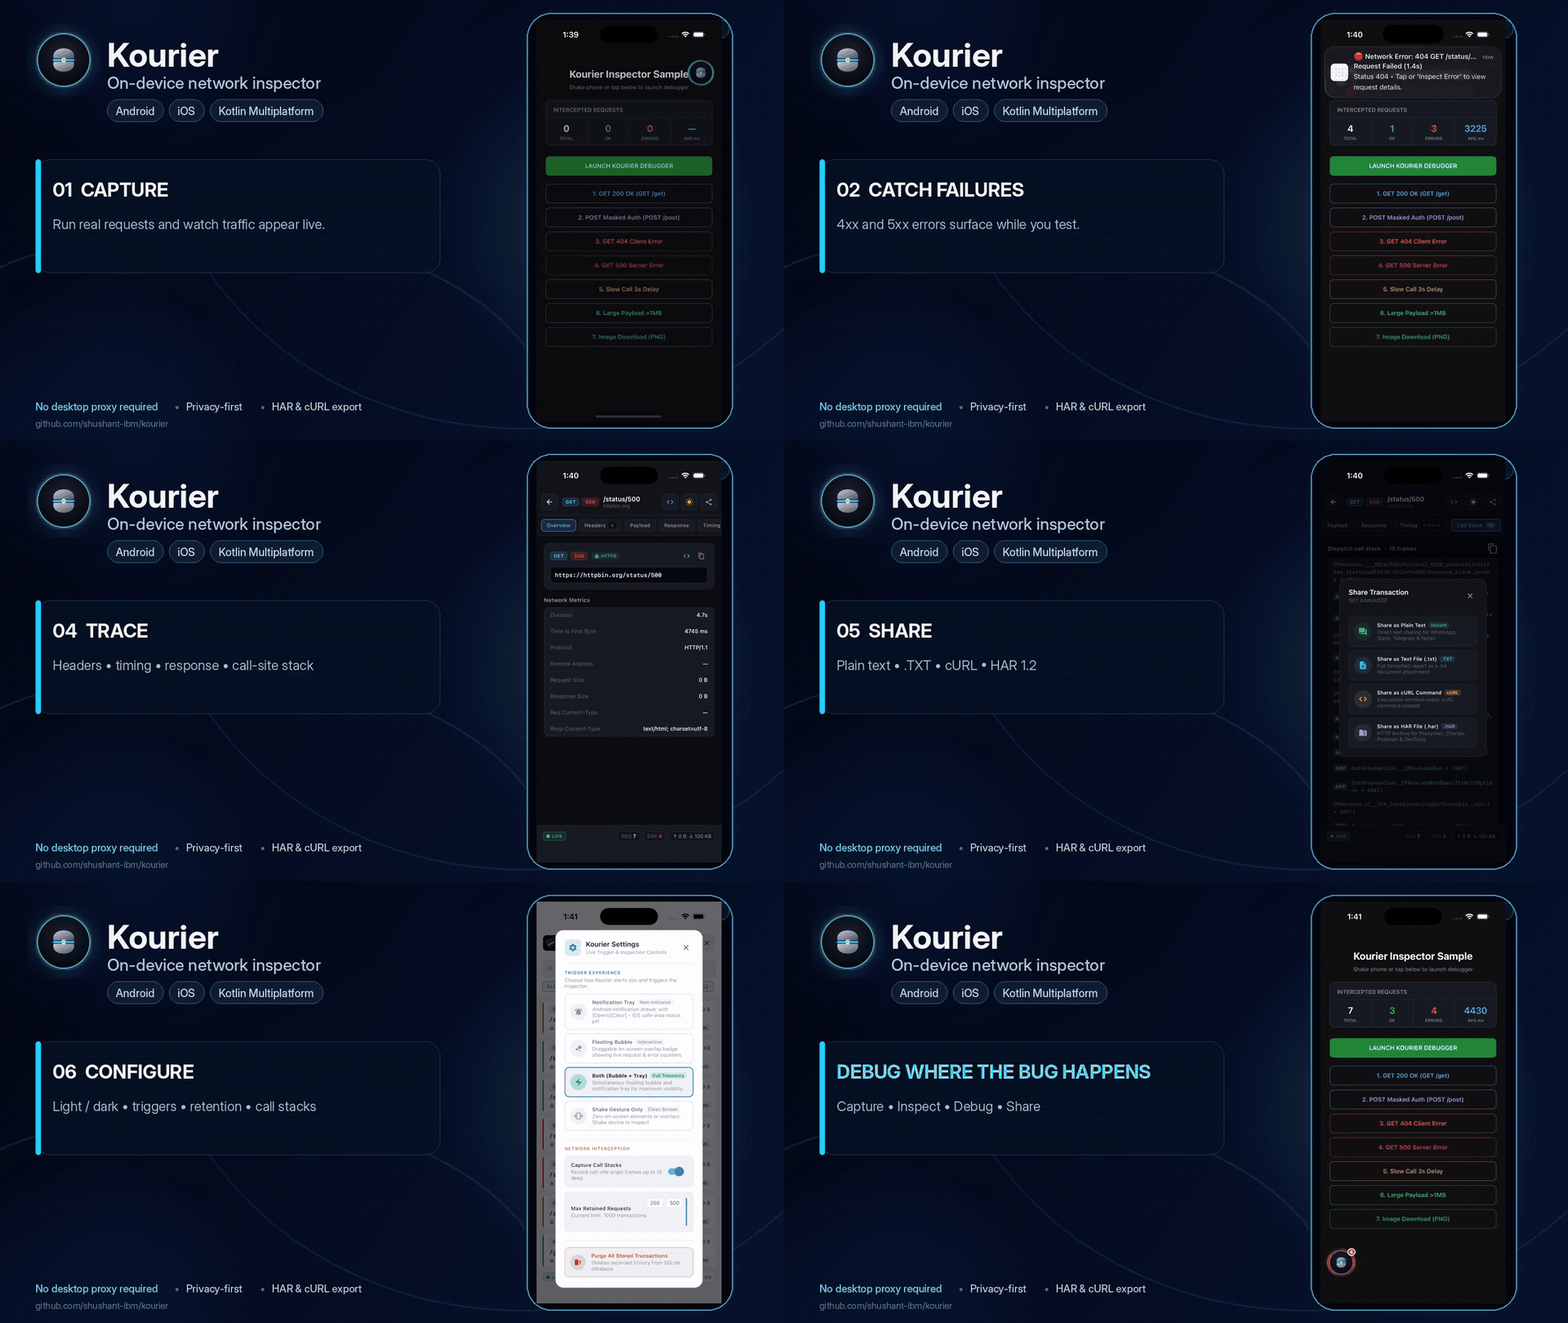
What is Kourier?
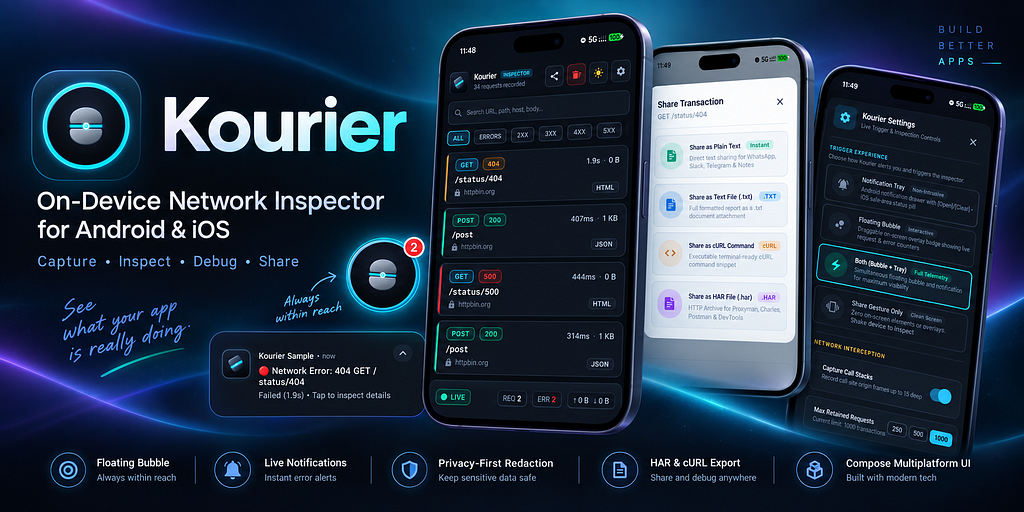
Kourier is an open-source, on-device network inspector for Android and iOS built with Kotlin Multiplatform and Compose Multiplatform.
Instead of moving application traffic outside the device for inspection, Kourier brings the debugging experience directly into the application.
A tester can:
- reproduce an API failure,
- inspect the exact request and response,
- review headers, payloads, status codes, timings, and call-site information,
- export the request as cURL or HAR,
- and share the diagnostic data with engineering.
No laptop connection is required for the basic debugging workflow.
No proxy configuration is required.
No certificate setup is required.
The architecture follows one principle:
Intercept natively. Normalize centrally. Inspect uniformly.
Kourier is open source:
Source repository
https://github.com/dev-shushant/kourier-kmp
Distribution repository
https://github.com/dev-shushant/kourier
But building an HTTP logger was not the interesting part.
The harder question was:
What should an on-device network inspector look like if it is designed for real mobile engineering teams — not only for developers sitting in front of Android Studio or Xcode?
That question shaped almost every architectural decision that followed. The examples below use the verified public release, 0.0.1. For current installation requirements and platform setup, see https://github.com/dev-shushant/kourier.
Kourier at a glance
Platforms: Android + iOS
Architecture: Kotlin Multiplatform + native interception
Android: OkHttp + Ktor
iOS: URLSession
UI: Compose Multiplatform
Persistence: SQLDelight
Exports: HAR 1.2, cURL, diagnostic reports
Privacy: Header, query parameter, and payload redaction
Production: API-compatible Android no-op artifact
Distribution: Maven + Swift Package Manager
License: Open source
The Architecture Rule That Shaped Kourier
Android and iOS have very different networking ecosystems.
Android applications commonly use:
OkHttp
   │
Retrofit
   │
Ktor
while Apple’s networking ecosystem revolves primarily around:
URLSession
   │
Alamofire
   │
Moya
One tempting approach would have been forcing both platforms through a common networking client.
I deliberately avoided that.
A debugging SDK shouldn’t require an application to redesign its networking architecture just to obtain debugging information.
Instead, Kourier follows a simple principle:
Intercept natively. Normalize centrally. Inspect uniformly.
Conceptually, the architecture looks like this:
                         ┌───────────────────────────┐
                         │     Host Application      │
                         └─────────────┬─────────────┘
                                       │
                              HTTP / HTTPS Traffic
                                       │
                 ┌─────────────────────┴─────────────────────┐
                 │                                           │
              Android                                       iOS
                 │                                           │
       ┌─────────┴──────────┐                      ┌─────────┴──────────┐
       │ OkHttp             │                      │ URLSession         │
       │ Retrofit           │                      │ Alamofire          │
       │ Ktor Client 3.x    │                      │ Moya               │
       └─────────┬──────────┘                      └─────────┬──────────┘
                 │                                           │
       KourierOkHttpInterceptor                    KourierURLProtocol
       KourierKtorPlugin                                     │
                 │                                           │
                 └─────────────────────┬─────────────────────┘
                                       ▼
                              ┌──────────────────┐
                              │   KourierCore    │
                              │ Shared KMP Model │
                              └────────┬─────────┘
                                       │
                     ┌─────────────────┼──────────────────┐
                     │                 │                  │
                     ▼                 ▼                  ▼
                Data Masking       Event Stream      SQLDelight
                & Truncation      Live Telemetry      Storage
                     │                 │                  │
                     └─────────────────┼──────────────────┘
                                       ▼
                           ┌────────────────────────┐
                           │ Compose Multiplatform  │
                           │   Network Inspector    │
                           └────────────┬───────────┘
                                        │
                     ┌──────────────────┼──────────────────┐
                     ▼                  ▼                  ▼
                 Plain Text          HAR 1.2            cURL
                  Reports            Export             Replay
There are two important ideas hidden inside this diagram.
The first is that interception remains platform appropriate.
The second is that everything after capture works with the same conceptual HTTP transaction.
That shared representation is what makes the rest of Kourier possible.
Android Had an Obvious Hook: OkHttp
On Android, OkHttp is one of the most common networking foundations, either directly or indirectly through Retrofit.
That makes an interceptor the natural integration point.
Kourier can be attached like any other OkHttp interceptor:
val okHttpClient = OkHttpClient.Builder()
    .addInterceptor(KourierOkHttpInterceptor())
    .build()
The important characteristic here is that Kourier doesn’t own the OkHttpClient.
The host application does.
Kourier simply observes traffic passing through it.
For applications using Ktor Client 3.x, the same idea is exposed through a Ktor plugin:
val client = HttpClient(OkHttp) {
    install(KourierKtorPlugin)
}
Kourier does not own the host application’s networking stack.
It observes the traffic already flowing through it.
That means the SDK does not need to dictate authentication, caching, retries, serialization, certificate pinning, dependency injection, or the HTTP client lifecycle.
The application owns networking. Kourier owns inspection.
iOS Was a More Interesting Problem
Android interceptors provide a relatively obvious extension point.
iOS is different.
URLSession sits underneath an enormous amount of Apple's networking ecosystem. Alamofire and many other abstractions eventually rely on URL loading infrastructure.
So instead of asking users to rewrite their networking stack, Kourier integrates with URLSessionConfiguration.
At application startup:
KourierURLSessionConfiguration.shared.install()For applications that create their own configurations — something commonly done with Alamofire or Moya — Kourier can instrument the configuration explicitly:
let configuration = URLSessionConfiguration.defaultKourierURLSessionConfiguration.shared.enable(
configuration: configuration
)let session = URLSession(configuration: configuration)The goal is the same as on Android:
integrate at the networking boundary without becoming the networking architecture.
That distinction matters even more in large applications where different teams may own different service layers.
Android and iOS Needed One Debugging Language
Once traffic has been intercepted, Android-specific or iOS-specific representations quickly become inconvenient.
A request must look conceptually identical regardless of which platform produced it.
Kourier therefore normalizes captured traffic into a shared Kotlin Multiplatform domain model.
A simplified version looks like this:
data class HttpTransaction(
    val id: String,
    val timestamp: Long,
    val request: HttpRequest,
    val response: HttpResponse?,
    val error: ErrorPayload?,
    val status: TransactionStatus,
    val timings: HttpTimings,
    val callStack: List<CallStackElement>,
    val protocol: String?,
    val tlsVersion: String?,
    val totalBytesSent: Long,
    val totalBytesReceived: Long
)
A request contains information such as:
data class HttpRequest(
    val url: String,
    val method: String,
    val headers: List<HttpHeader>,
    val body: String?,
    val contentType: String?,
    val contentLength: Long,
    val isTruncated: Boolean
)
while responses follow the same model:
data class HttpResponse(
    val statusCode: Int,
    val message: String,
    val headers: List<HttpHeader>,
    val body: String?,
    val contentType: String?,
    val contentLength: Long,
    val isTruncated: Boolean,
    val fromCache: Boolean
)
This is more important than simply “sharing code”.
It creates a shared debugging vocabulary.
A 500 POST /checkout is represented the same way regardless of whether it originated from OkHttp on Android or URLSession on iOS.
Once both platforms produce the same transaction model, the rest of the system becomes shared:
- inspector UI,
- filtering,
- redaction,
- persistence,
- retention,
- HAR generation,
- cURL generation.
That is where Kotlin Multiplatform becomes more valuable than simply “sharing code.”
It creates one debugging vocabulary across both platforms.
That is where Kotlin Multiplatform starts delivering architectural value rather than simply reducing the number of source files.
A Network Inspector Must Never Become the Network Problem
This was one of the constraints I cared about most.
Imagine installing a debugging SDK to investigate a slow API only to discover that the debugger itself is making every request slower.
That defeats the purpose.
Kourier’s capture pipeline is therefore designed so that inspection work is separated as much as possible from the actual network round-trip.
Conceptually:
Request begins
     │
     ├──────► Real network operation continues
     │
     └──────► Capture metadata
                    │
                    ▼
             Normalize telemetry
                    │
                    ▼
              Redact / truncate
                    │
             ┌──────┴───────┐
             ▼              ▼
        Event stream      Storage
Telemetry can then update the UI and ambient indicators independently of the networking operation itself.
Another important constraint is payload size.
A debugging tool cannot blindly retain every byte of every response.
Imagine inspecting:
- a 20 MB image,
- a video segment,
- a giant JSON document,
- or an unexpectedly large backend response.
Allowing unlimited capture would turn the inspector into a memory-pressure generator.
Kourier therefore exposes a payload cap:
maxPayloadSize(500 * 1024L)When that threshold is exceeded, Kourier retains only the configured amount and marks the payload as truncated.
That tiny isTruncated flag in the domain model exists because resource safety is part of observability.
A Debugger That Stores Everything Eventually Becomes a Problem
Developers love logs.
Storage doesn’t.
A useful inspector needs history, because the request causing the problem may have occurred several screens ago.
But unlimited history is not acceptable.
Kourier uses SQLDelight-backed local SQLite persistence and exposes two complementary retention limits:
maxRetentionCount(1000)
retentionPeriodDays(3)
This means storage can be bounded both by quantity and time.
For example:
Keep no more than:       1,000 transactions
And no older than:       3 days
That gives teams enough history for debugging while ensuring the inspector doesn’t become permanent application data storage.
It also makes “clear traffic” meaningful.
The inspector isn’t just displaying transient log statements; it is working with structured diagnostic data that has an explicit lifecycle.
Network Debugging Sees Data It Should Never Leak
A network inspector sees some of the most sensitive information in an application.
Potentially:
Authorization: Bearer eyJ...
Cookie: session=...
X-Api-Key: ...
and payloads such as:
{
  "email": "user@example.com",
  "password": "super-secret",
  "payment": {
    "card_number": "....",
    "cvv": "..."
  }
}
Simply saying “don’t use the tool in production” is not enough.
QA and staging environments frequently contain realistic accounts, tokens, customer-like datasets, and integration credentials.
Kourier therefore applies redaction before diagnostic data is persisted.
Configuration can look like:
redactHeaders(
    "Authorization",
    "Cookie",
    "X-Api-Key",
    "X-Session-Token"
)
redactPayloadKeys(
    "password",
    "token",
    "secret",
    "credit_card",
    "ssn",
    "cvv"
)
redactQueryParams(
    "token",
    "apiKey",
    "secret"
)
One detail I particularly wanted to avoid was treating JSON masking as a simple string replacement problem.
Consider:
{
  "user": {
    "profile": {
      "credentials": {
        "access_token": "secret-value"
      }
    }
  }
}
or:
{
  "accounts": [
    {
      "token": "secret-1"
    },
    {
      "token": "secret-2"
    }
  ]
}
Sensitive fields can appear at arbitrary nesting levels and inside arrays.
Kourier’s data masker therefore recursively traverses structured JSON rather than relying only on superficial text matching.
The result becomes something conceptually like:
{
  "accounts": [
    {
      "token": "••••••••"
    },
    {
      "token": "••••••••"
    }
  ]
}
Security tooling often focuses on what data can be captured.
For an enterprise debugging SDK, I think an equally important question is:
What data should never survive capture?
One Inspector UI, Two Very Different Screen Sizes
Once Android and iOS are producing the same telemetry model, building completely separate inspector interfaces starts to feel wasteful.
Kourier therefore uses Compose Multiplatform for the inspection experience.
This allows the same UI architecture to run on:
- Android phones,
- Android tablets,
- foldables,
- iPhones,
- and iPads.
But “same UI code” shouldn’t mean “same fixed layout everywhere”.
A network inspector contains inherently information-dense content:
Request list
URL
HTTP method
Status
Headers
Query parameters
Request body
Response body
Timings
Call stack
Protocol metadata
Export actions
On a phone, displaying all of that simultaneously would be terrible.
So the phone experience follows a focused navigation model:
Transactions
     │
     ▼
Selected Transaction
     │
     ├── Overview
     ├── Request
     ├── Response
     ├── Headers
     ├── Timings
     └── Call Stack
On an iPad or tablet, there is enough horizontal space for a master-detail experience:
┌─────────────────────┬───────────────────────────────────────────┐
│ Transactions        │ GET /api/chargers                        │
│                     │                                           │
│ 200  GET /profile   │ Status: 200                               │
│ 500  POST /booking  │ Duration: 312 ms                          │
│ 200  GET /chargers  │                                           │
│ 401  GET /session   │ Request Headers                           │
│                     │ Response Body                             │
│                     │ Timings                                   │
│                     │ Call Stack                                │
└─────────────────────┴───────────────────────────────────────────┘
This is one of the areas where Compose Multiplatform was particularly valuable.
The telemetry model and inspector behavior remain shared while the layout adapts to the device.
Opening the Inspector Shouldn’t Require Hunting for a Debug Menu
Another small problem became surprisingly important.
How does a tester actually open Kourier?
If the answer is:
Settings → Developer → Debugging → Network → Inspector
then the debugging tool is already harder to use than it needs to be.
Kourier therefore supports multiple trigger styles:
enum class TriggerStyle {
    NOTIFICATION_TRAY,
    FLOATING_BUBBLE,
    BOTH,
    SHAKE_ONLY
}
That lets the host application decide how visible the debugger should be.
For active internal development:
triggerStyle(TriggerStyle.BOTH)A draggable bubble gives immediate access while telemetry remains available through the system notification area.
For QA builds where the product team doesn’t want an overlay floating over the application:
triggerStyle(TriggerStyle.NOTIFICATION_TRAY)For minimal interference:
triggerStyle(TriggerStyle.SHAKE_ONLY)And the inspector can always be opened programmatically.
The important design decision here was not choosing one perfect trigger.
It was accepting that different teams have different debugging environments.
The SDK should adapt to the application, not the other way around.
What If QA Knew an API Failed Before Opening the Inspector?
While building Kourier, I realized that there are actually two debugging questions.
The obvious one is:
What happened in this request?
But before that comes another question:
Did something just go wrong?
Kourier exposes live telemetry so the developer doesn’t need to keep the inspector permanently open.
Conceptually, the ambient view can show:
KOURIER NETWORK INSPECTOR          Active

142 requests
2 errors
124 KB ↑
1.8 MB ↓
200  GET  /api/auth/session
500  POST /api/orders/checkout
[ Open Inspector ]    [ Clear Traffic ]
Normal traffic can update quietly.
Errors deserve more attention.
That distinction is important.
A debugging SDK that generates a system alert for every successful 200 response would become unusable within minutes.
Kourier therefore treats normal network activity as ambient telemetry and reserves higher-priority error signaling for cases such as:
4xx
5xx
Timeout
Transport failure
There is also a deliberate single-notification architecture rather than creating a new notification for every transaction.
The telemetry surface updates in place.
No notification graveyard.
Capturing the Failure Is Only Half the Workflow
Suppose QA reproduces this:
POST /api/orders/checkout
500 Internal Server Error
They open Kourier and see exactly what happened.
Great.
But the next step is usually sharing it with someone.
That is why export became a first-class feature rather than an afterthought.
Kourier supports several representations because each one solves a different debugging workflow.
1. Human-readable text
For Slack, Teams, WhatsApp, Telegram, issue trackers, or notes:
[Kourier] 500 POST https://api.example.com/checkout
Duration: 420 ms
Response: Internal Server Error
Request Body:
{
  "orderId": "12345"
}
Error:
Missing payment_nonce
This is optimized for communication.
2. Diagnostic report
When somebody needs the full context, Kourier can export a diagnostic text file containing information such as:
Request URL
HTTP Method
Headers
Request Body
Response Headers
Response Body
Connection Timings
Call Stack
Protocol Information
This is optimized for investigation.
3. HAR 1.2
HAR is particularly useful because it moves debugging from the device back into familiar desktop tooling.
A tester can reproduce the issue using only the phone and then send the HAR file to an engineer.
The engineer can import it into tools such as:
Proxyman
Charles
Chrome DevTools
Postman
Now the same captured transaction can participate in the engineer’s normal debugging workflow.
This is optimized for interoperability.
4. cURL
Sometimes the fastest debugging tool is still the terminal.
Kourier can generate an executable cURL representation of a request:
curl 'https://api.example.com/checkout' \
  -X POST \
  -H 'Content-Type: application/json' \
  -H 'Authorization: ••••••••' \
  --data '{"orderId":"12345"}'
Now the mobile request can be replayed independently of the application, after supplying valid credentials locally wherever redaction has masked them.
This is optimized for replay.
That distinction — communication, investigation, interoperability, replay — is why I decided not to build a single generic “Share” format.
Which Part of the App Actually Triggered This Request?
An HTTP request tells you which endpoint failed.
It doesn’t always tell you which part of a large application generated it.
This becomes particularly painful when the same endpoint is called from several features.
Kourier can optionally capture the originating call stack:
captureCallStack(
    true,
    maxDepth = 15
)
Instead of only seeing:
GET /api/user/profilethe engineer can trace the request closer to its application origin.
This turns the inspector from a traffic viewer into something closer to a diagnostic system.
The HTTP layer tells you what happened.
Call-site tracing helps answer where it came from.
What Happens When a Debugging SDK Reaches Production?
There is an uncomfortable question every debugging SDK eventually has to answer:
What happens when this library reaches a production build?
An if (BuildConfig.DEBUG) around initialization isn't quite the same thing as removing the inspection implementation.
The code may still exist.
Dependencies may still exist.
Storage components may still exist.
Someone may accidentally initialize them later.
I wanted a stronger boundary.
On Android, Kourier therefore provides a separate production artifact:
dependencies {
    debugImplementation(
        "dev.shushant.kourier:kourier-android:0.0.1"
    )

    releaseImplementation(
        "dev.shushant.kourier:kourier-noop:0.0.1"
    )
}
The important property of kourier-noop is API compatibility.
The application can continue calling:
Kourier.init(this) {
    maxRetentionCount(1000)
}
without sprinkling debug checks throughout application code.
In a debug build, that API connects to the real implementation.
In a release build, the same calls resolve to pass-through/no-op behavior.
Conceptually:
                    Application Code
                          │
                          │ same API
                          ▼
             ┌────────────┴─────────────┐
             │                          │
          DEBUG                       RELEASE
             │                          │
             ▼                          ▼
     kourier-android               kourier-noop
             │                          │
      Capture / UI / DB           pass-through
      Telemetry / Export          no inspector runtime
This approach provides a much cleaner architectural boundary than relying solely on runtime flags.
R8 can then remove unused release-side code as part of normal optimization.
For tooling that observes sensitive network traffic, I prefer build-time separation whenever possible.
An SDK Isn’t Finished Until Someone Else Can Install It
An SDK isn’t finished when its source code works.
It’s finished when another developer can integrate it without understanding your repository.
Kourier therefore has separate distribution paths for Android and iOS.
At the time of writing, the public package is available through:
GitHub:
https://github.com/dev-shushant/kourier
Android artifacts are exposed through a public Maven repository hosted from GitHub, so consuming applications don’t need a personal GitHub token.
For iOS, Kourier is built as a binary XCFramework and distributed through Swift Package Manager.
The SPM target references a versioned release artifact:
.binaryTarget(
    name: "KourierIos",
    url: ".../KourierIos.xcframework.zip",
    checksum: "..."
)
The publishing pipeline:
Verify
  │
  ▼
Build Android artifacts
  │
  ├────► Publish Maven artifacts
  │
  ▼
Build iOS XCFramework
  │
  ▼
Archive XCFramework
  │
  ▼
Compute SHA-256 checksum
  │
  ▼
Generate Package.swift
  │
  ▼
Tag version
  │
  ▼
Create GitHub release
This was another useful reminder while building the project:
SDK architecture includes distribution architecture.
If adding a library requires manually copying frameworks, configuring authentication tokens, resolving transitive build issues, and reading twenty pages of setup instructions, the API design doesn’t matter much.
Developer experience starts before init() is called.
A Minimal Android Integration
Putting the pieces together, a typical Android setup looks like this.
Add Kourier:
dependencies {
    debugImplementation(
        "dev.shushant.kourier:kourier-android:0.0.1"
    )

    releaseImplementation(
        "dev.shushant.kourier:kourier-noop:0.0.1"
    )
}
Initialize it:
class MyApplication : Application() {

        override fun onCreate() {
              super.onCreate()
        Kourier.init(this) {
            maxPayloadSize(500 * 1024L)
            maxRetentionCount(1000)
            retentionPeriodDays(3)
            redactHeaders(
                "Authorization",
                "Cookie",
                "X-Api-Key"
            )
            redactPayloadKeys(
                "password",
                "token",
                "secret",
                "credit_card"
            )
            redactQueryParams(
                "token",
                "apiKey",
                "secret"
            )
            triggerStyle(TriggerStyle.BOTH)
            captureCallStack(
                true,
                maxDepth = 15
            )
        }
    }
}
Then instrument the network client:
val client = OkHttpClient.Builder()
    .addInterceptor(KourierOkHttpInterceptor())
    .build()
That’s essentially the host application’s responsibility.
Kourier owns the inspection workflow from there.
A Minimal iOS Integration
The iOS equivalent starts by adding the Swift Package:
https://github.com/dev-shushant/kourier.gitThen initialize the SDK:
import KourierIos

Kourier.shared.doInit { builder in
    builder.maxPayloadSize(bytes: 500 * 1024)
    builder.maxRetentionCount(count: 1000)
    builder.retentionPeriodDays(days: 3)
    builder.triggerStyle(style: .both)
    builder.captureCallStack(
        enable: true,
        maxDepth: 15
    )
}
Install URLSession interception:
KourierURLSessionConfiguration.shared.install()Add the required platform configuration from the distribution README to complete setup. Configure iOS inspection separately for production builds.
Custom URLSession configurations can be instrumented individually when required.
Five Things Building Kourier Taught Me About SDK Design
Kourier started as a networking utility.
It quickly became an exercise in SDK architecture.
A few lessons stood out.
1. Multiplatform doesn’t mean everything should be shared
The correct abstraction wasn’t “one interceptor for Android and iOS”.
Those platforms expose networking differently.
The better boundary was:
Platform-specific capture
          +
Shared normalized telemetry
Share the domain.
Respect the platform.
2. Debugging tools need stricter resource limits than normal features
A product feature generally knows what data it expects.
A network debugger does not.
Tomorrow somebody could download a 100 MB response through it.
Payload limits and retention rules therefore aren’t optional optimizations.
They’re part of correctness.
3. Observability without privacy controls is dangerous
Capturing everything is easy.
Capturing the right information while preventing credentials from leaking into screenshots, exports, or local storage is significantly harder.
Redaction should sit near the beginning of the telemetry lifecycle, not at the export button.
4. QA is a first-class user of developer tooling
A surprising amount of debugging infrastructure assumes the person reproducing the problem has Xcode or Android Studio open.
That isn’t always true.
Designing for the QA engineer holding only a phone changes the product:
Open inspector easily
Understand status visually
Search traffic
Share immediately
Export diagnostic artifacts
Those aren’t cosmetic features.
They shorten the path from bug reproduction to root cause.
5. “No-op in production” is an architectural feature
It is very easy to add a debugging library.
It should be equally easy to guarantee that its behavior isn’t active in production.
Compile-time dependency separation is much easier to reason about than dozens of runtime if debug checks.
Where Kotlin Multiplatform Actually Helped
Kotlin Multiplatform was not interesting here merely because it let me say that Kourier supports Android and iOS.
The more valuable part was being able to share the areas where consistency genuinely matters:
HTTP transaction model
Configuration
Redaction rules
Telemetry state
Persistence logic
Filtering
Export logic
Inspector UI
while keeping platform-specific responsibilities where they naturally belong:
OkHttp interception
Ktor integration
URLSession interception
Platform lifecycle
System notifications
Window / overlay behavior
Native packaging
That balance is what made KMP fit the project.
Not “write once, run everywhere”.
More like:
Write the domain once. Integrate appropriately everywhere.
Kourier Isn’t Trying to Replace Charles or Proxyman
Kourier is not intended to replace every desktop network debugging tool.
Charles and Proxyman remain vastly more powerful for many deep debugging scenarios.
That’s not the problem Kourier tries to solve.
Kourier solves the gap before those tools become available.
The QA engineer can reproduce the failure.
The device captures the transaction.
Sensitive information is masked.
The transaction can be inspected immediately.
Then it can be exported as text, HAR, or cURL and handed to engineering.
So instead of:
Bug reproduced
    ↓
Ask developer to reproduce
    ↓
Configure proxy
    ↓
Try again
    ↓
Maybe reproduce
    ↓
Investigate
the workflow becomes:
Bug reproduced
    ↓
Open Kourier
    ↓
Inspect failed request
    ↓
Share / export
    ↓
Investigate
Kourier’s value isn’t better logs. It’s a shorter debugging loop.
What’s next
Kourier currently focuses on reliable capture and diagnosis.
The next interesting layer is reasoning over the telemetry already available on-device:
- repeated API failure detection,
- slow endpoint identification,
- duplicate request detection,
- retry-storm detection,
- payload regressions,
- authentication failures,
- request dependency analysis.
The challenge is doing this without turning a privacy-first debugging tool into another cloud telemetry pipeline.
That is the direction I want to explore next.
Final Thoughts
Why should debugging an API failure on a physical device require access to a developer’s machine?
What looked like a network logging problem quickly became an SDK architecture problem involving native networking, Kotlin Multiplatform, Swift interoperability, Compose Multiplatform, storage, privacy, resource management, distribution, and production safety.
The biggest lesson was that useful debugging infrastructure isn’t just about collecting more information.
It’s about shortening the distance between:
“Something failed on this device.”
and:
“Here is exactly what happened.”
Kourier is open source, and I’d genuinely like feedback from Android, iOS, and Kotlin Multiplatform engineers working on similar tooling.
Source
https://github.com/dev-shushant/kourier-kmp
Distribution
https://github.com/dev-shushant/kourier
If Kourier is useful to you, a GitHub ⭐ or technical feedback would help shape where the project goes next.
Built with Kotlin Multiplatform, Compose Multiplatform, SQLDelight, OkHttp, Ktor, URLSession, and a lot of curiosity about making mobile debugging less painful.